Key findings
Consistent outperformance across regions
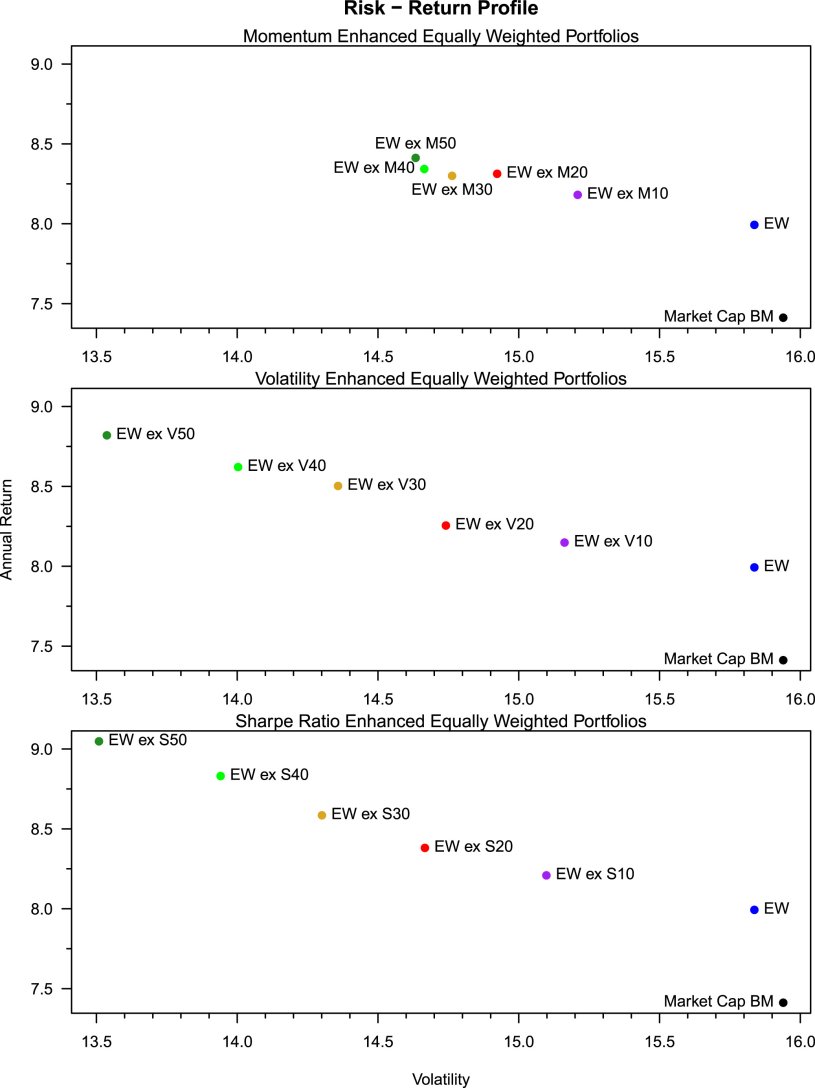
Each of the factor filters outperforms both the equal-weighted and market capitalization-weighted benchmarks in terms of return and risk-adjusted metrics in the AC, US, Europe, Developed, and EM regions. In Figure 1, the portfolio moves to the top left of the risk-return chart as more stocks with poor factor scores are excluded.
With the momentum screen, returns generally rise and volatility and drawdowns generally fall as exclusion rates increase; the Sharpe ratio improvements are economically significant and statistically significant in Europe (Ledoit–Wolf test).
The volatility filter shows monotonous Sharpe gains when highly volatile names are removed. Even excluding the top 10% by volatility leads to higher returns, lower volatility, and smaller maximum drawdowns than pure equal weighting—robust in all five regions; the Sharpe differences are significant at the 95% level or higher. The additional turnover remains moderate.
The Sharpe ratio filter proves to be the most robust all-rounder: risk-adjusted outperformance relative to EW ranges from ~28% (US) to ~55% (Europe), with statistical significance in all regions except EM. In addition, downside metrics (Sortino, Calmar, Omega) improve. This is achieved by combining the two factors of momentum (in the numerator) and low volatility (in the denominator).
Resilience to transaction costs
A sensitivity analysis shows that all three filter variants outperform pure equal weighting even with transaction costs of up to 150 basis points – an unrealistically high figure for the large- and mid-cap universe under consideration. The momentum approach reacts more strongly to the rebalancing frequency; volatility and Sharpe variants remain largely unaffected by the change from monthly to weekly or quarterly rebalancing.
Robustness over time and parameters
Rolling 3-year Sharpe ratios show that all three factor filters have dominated for most of the last 20 years. The results remain stable when compared with alternative parameters and rebalancing schemes, particularly in the case of the volatility and Sharpe ratio filters. Alternative factor-based filter criteria such as quality and value were also examined and deliver positive effects, but these are less pronounced and robust.
Economic intuition and factor exposures
Due to their design, factor filters convert the negative exposures of the 1/N portfolio to momentum and low volatility into neutral to positive exposures while maintaining the exposures to size and short-term reversal – the result is a simple, long-only multi-factor portfolio.
Classification in the literature and OLZ investment practice
The results are consistent with long-standing evidence on momentum and low-risk premiums, as well as with studies that attribute the observed returns of the equally weighted portfolio to factor exposures and rebalancing effects.
What we show: A single filter step – using only historical returns – generates reliable, out-of-sample improvements across regions and market regimes. The results once again underscore the attractive return and risk characteristics of momentum and low-volatility portfolios, which are supported by a broad scientific basis.
The risk and momentum filters examined in this study are already used in numerous OLZ investment products. In addition, they can be integrated into customized investment solutions together with other factor tilts or sustainability criteria in order to map investors' multidimensional investment objectives as accurately as possible.
Conclusion
No complex models or extensive or difficult-to-access data are needed to outperform the 1/N portfolio. A simple, transparent filter—based on momentum, volatility, or Sharpe ratio—followed by equal weighting consistently outperforms the 1/N and market capitalization benchmarks in terms of return (after costs) and risk. The established factors of low risk and momentum can thus be used to outperform two supposedly unbeatable benchmarks in a simple and reliable manner.
For methodological details, regional results tables, cost and frequency sensitivities, and rolling evaluations, please refer to the published article: https://www.sciencedirect.com/science/article/pii/S0165176525003891