03. December 2025
5 minutes

When valuations rise, risk management becomes crucial

High valuations, higher risks: Why OLZ risk optimization is particularly relevant now

High valuations in the MSCI World

The valuation of the MSCI World is now at dizzying heights. Looking at the price relative to the average earnings of the last ten years, it can be seen that valuations above the current level of 36.7 were last seen before the dot-com bubble burst.

Analysis period: December 31, 1997 – October 31, 2025; Source: Bloomberg, OLZ. Adjusted earnings = 10-year average of earnings
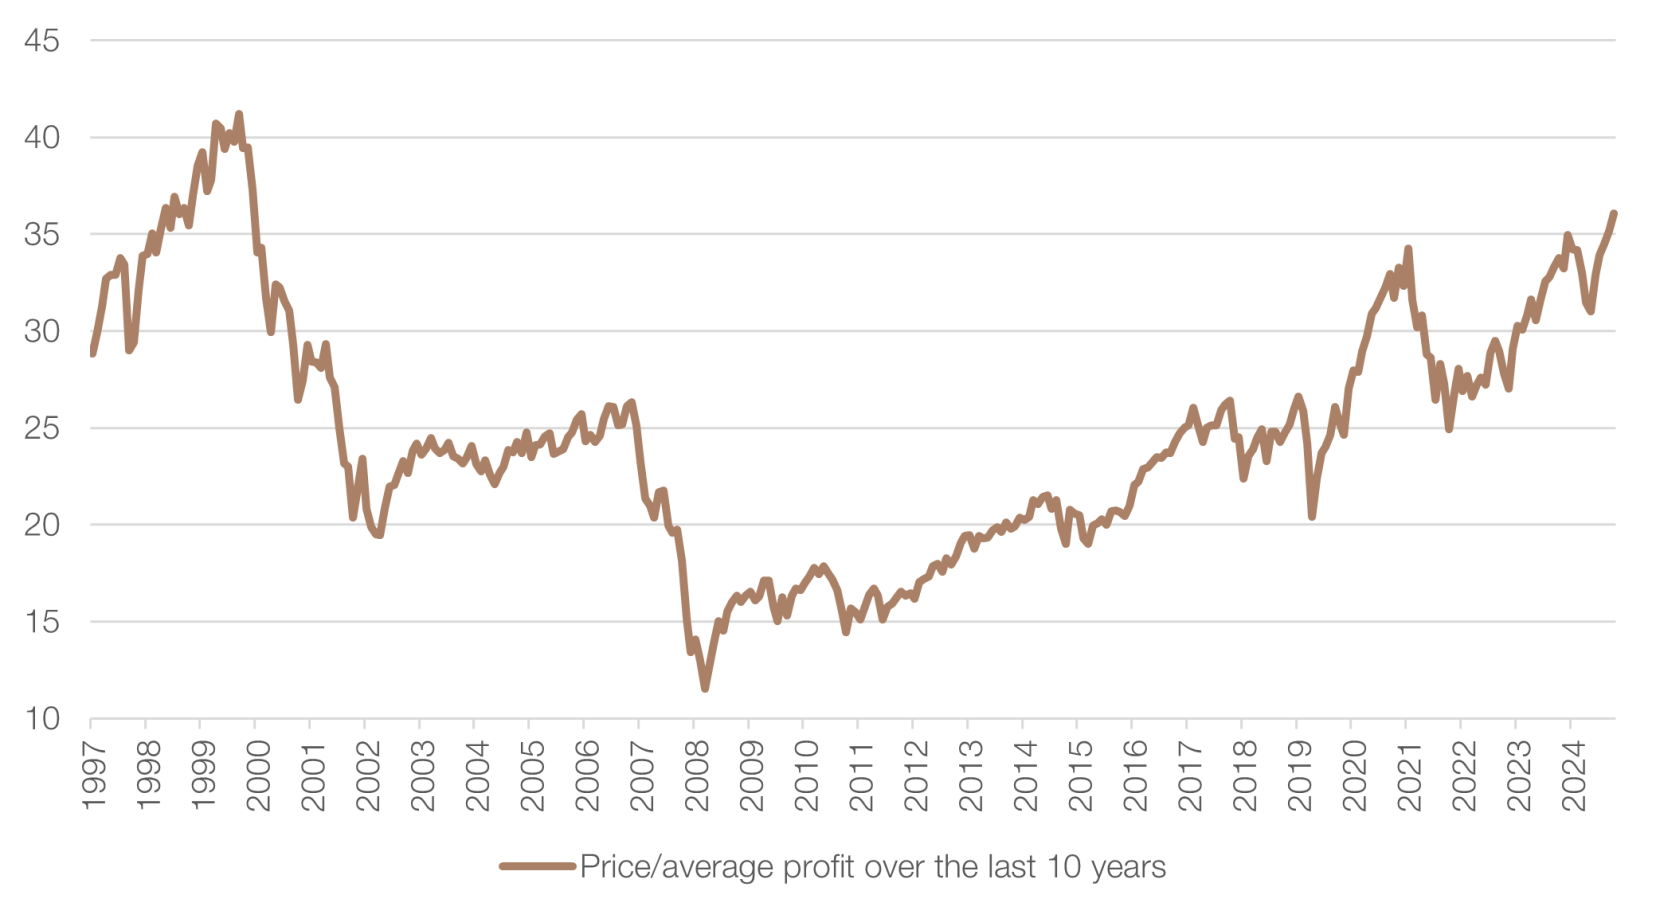
High valuations reduce expected returns

In the context of these high valuations, the question arises as to whether prices can continue to rise and move further away from their fundamental valuation. Naturally, high valuations reduce expected returns.

This correlation has been empirically proven in a large number of academic publications. One of the best-known papers on this subject was written by Campbell and Shiller (1998)* and shows that the relationship between current valuations and future 10-year returns is linearly declining.

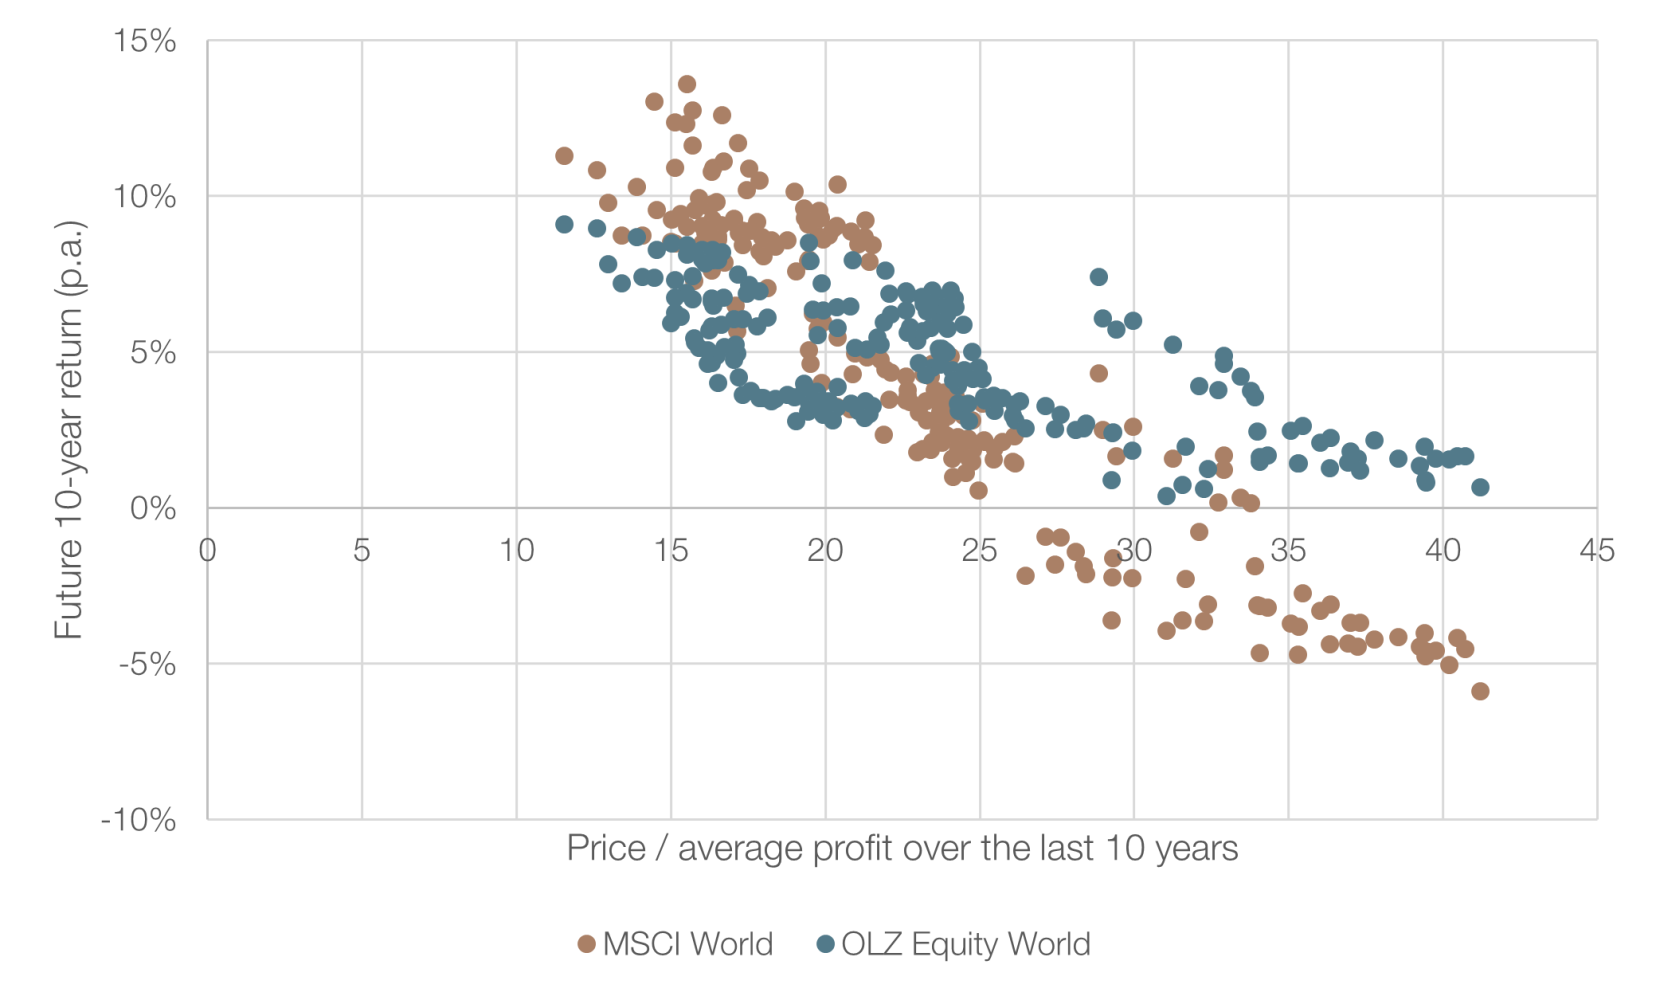
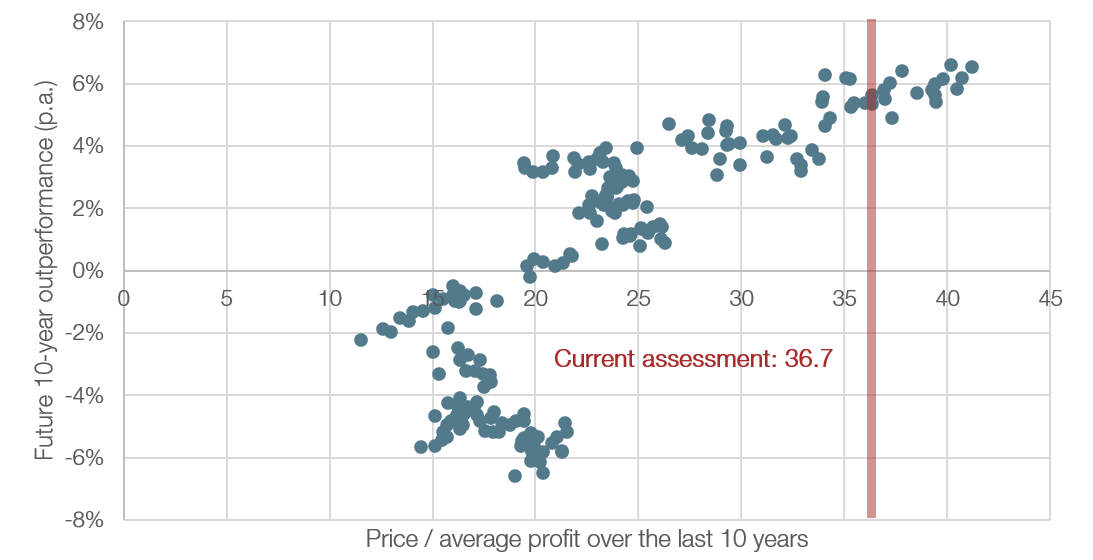
In order to understand how OLZ risk optimization relates to the valuation of the MSCI World, we examined the valuation of the MSCI World in relation to the future 10-year return of the MSCI World and the risk-reduction-oriented OLZ Equity World Optimized Fund, using a methodology similar to that of Campbell and Shiller.

Our analysis confirms the negative correlation between the valuation of the MSCI World and the future expected return of the MSCI World. With regard to the performance of the OLZ fund, an interesting observation can also be made: regardless of the valuation of the MSCI World, the performance over 10 years is always positive. The annualized return over 10 years fluctuates between 0.4% and 11.2% for the risk-optimized OLZ fund, while the MSCI World returns between -5.9% and 13.6%. This makes it clear that, in the best-case scenario, investors earn around 2.4% p.a. more with the MSCI World than with the OLZ fund, but they can also lose an average of -5.9% per year over 10 years.

Analysis period: December 31, 1997 – October 31, 2015; source: Bloomberg, OLZ. Adjusted earnings = annual average earnings over 10 years; total returns in CHF.
High valuations increase the likelihood of our OLZ funds outperforming

An analysis was conducted to more clearly illustrate the expected performance differences between our defensive approach and the capital-weighted MSCI World over the next ten years, based on historical data. The outperformance of the OLZ fund relative to the MSCI World was calculated depending on the respective valuation level of the MSCI World.

The analysis below clearly shows that the higher the valuation, the more likely the OLZ fund is to outperform the MSCI World, according to historical data. A very high valuation level also means a large fall, which argues in favor of a more defensive portfolio allocation. From a valuation of 22 onwards, the OLZ fund has consistently outperformed in the past. The current valuation of 36.7 therefore suggests that now is an attractive time to invest in our OLZ low-risk strategies. In contrast, during the period under review, there was no case in which the MSCI World achieved a positive return over the following 10 years based on a valuation above 35.

Analysis period: December 31, 1997 – October 31, 2015; Source: Bloomberg, OLZ. Adjusted earnings = 10-year average earnings; total returns in CHF

*John Y. Campbell und Robert J. Shiller, The Journal of Portfolio Management 1998, Valuation Ratios and the Long-Run Stock Market Outlook

We are always happy to talk to you.

A lasting relationship with our customers is worth more to us than mere success. Get in touch with us, we look forward to hearing from you. Or contact us directly: