13. November 2026
5 Minutes

When the Machine Learns to Steer an Asset Allocation: Reinforcement Learning in Wealth Management

In an innovation project funded by Innosuisse, OLZ AG and the Lucerne University of Applied Sciences and Arts investigated whether a self-learning computer model can allocate a portfolio across different asset classes better than proven classical methods. The results have now been published in the journal “Journal of Risk and Financial Management” [1].

The Basic Question Every Investor Faces

How much in stocks, how much in bonds, how much in gold? The split across asset classes, known as asset allocation, is one of the most important decisions in any investment strategy. For more than 70 years, the standard approach has been one that goes back to Nobel laureate Harry Markowitz. It requires two steps: First, you estimate the returns and volatility to expect from each asset class and how the assets influence one another. From this, the optimal mix is then calculated. The weakness lies in the first step. Future returns can only be estimated imprecisely, and even small estimation errors can lead to heavily distorted portfolios, without this being apparent at first glance.

The Idea: Learning Directly from Experience

The research team—Dr. Simon Broda (Institute of Financial Services Zug IFZ at the Lucerne University of Applied Sciences and Arts), Prof. Dr. Gianluca De Nard (University of Liechtenstein and University of Zurich), and Dr. Patrick Walker (OLZ AG and University of Zurich)—took a different path. Their model is a simple approach from reinforcement learning. Here, a computer program does not learn from predefined solutions but from the outcomes of its own decisions: It tries out allocations on historical data, receives feedback on how well they balanced return and risk, and adjusts its behavior step by step.

The difference from the classical approach can be illustrated with a simple question. The classical approach asks: What return will gold deliver next year? The new model asks: When interest rates are rising and markets are jittery, which mix has proven itself in such conditions? The error-prone detour through forecasting is eliminated.

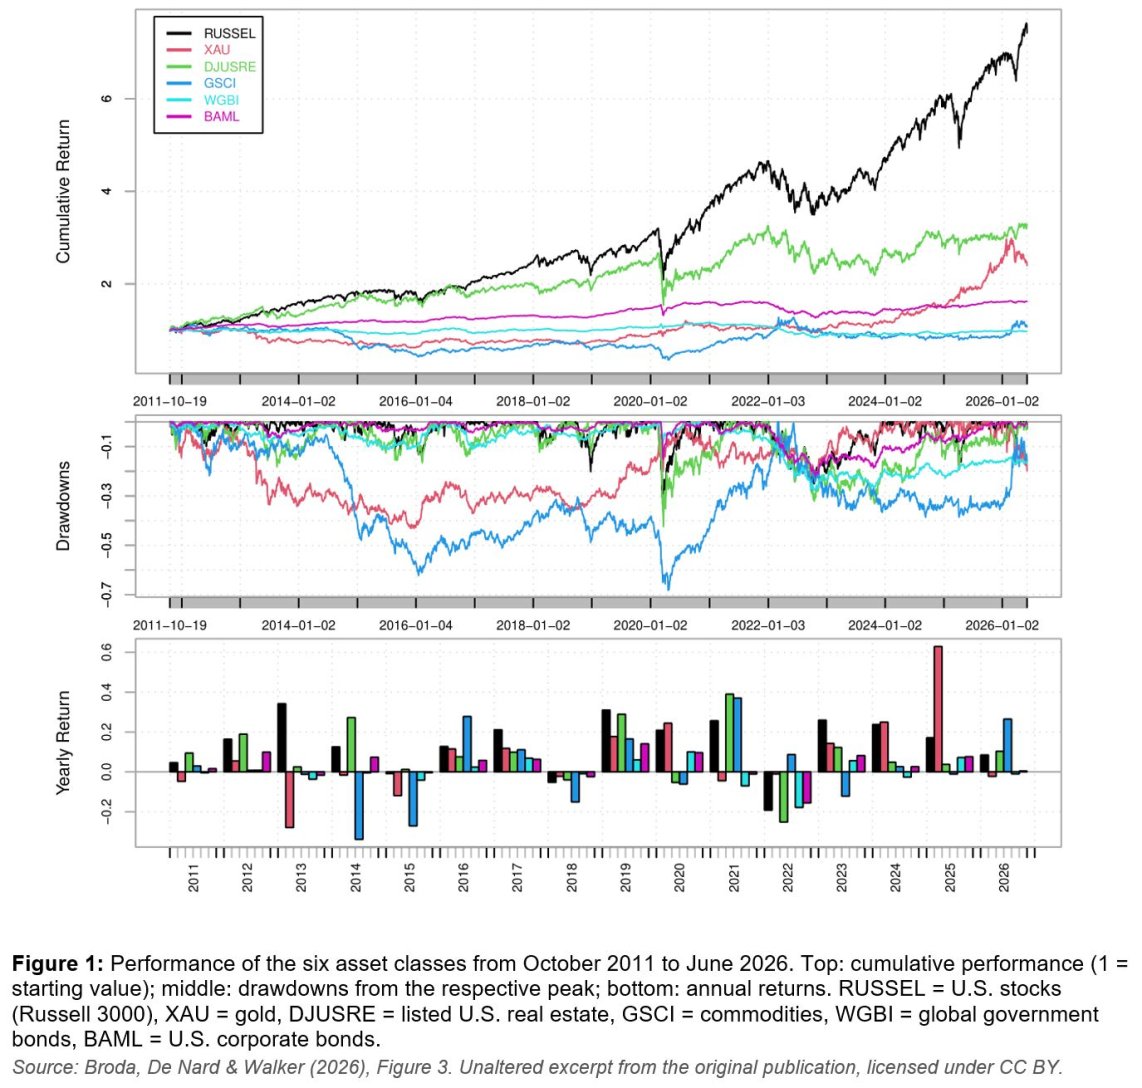
The model is based on the price performance and risk characteristics of the asset classes as well as economic indicators such as interest rates, inflation, unemployment, or market volatility. From these, it derives a new allocation once a month. The study examined six broad, predominantly U.S. asset classes, all of which can be replicated inexpensively through exchange-traded funds (ETFs): stocks, gold, listed real estate, commodities, government bonds, and corporate bonds (Figure 1).

Why a Simple Approach Is Enough

Reinforcement learning became famous through programs that master chess or Go. Such systems are complex because every move changes the rest of the game. Financial markets are different: An investor whose trading volume is small relative to the market does not influence prices. Today’s decision therefore does not change tomorrow’s starting position. The researchers take advantage of this and treat each month as an independent decision. As a result, the model gets by without the elaborate machinery of typical reinforcement learning systems and can be trained in a lean and fast manner.

A second trick comes on top of that: The model does not start from scratch but begins with the classical Markowitz solution and tries to improve on it step by step using the data.
What the Test Over More Than 14 Years Shows

The model was backtested from October 2011 to June 2026 in such a way that at any given point in time it only knew price and economic data that were actually available back then. It was compared with the classical Markowitz portfolio and a simple equal-weighted portfolio.

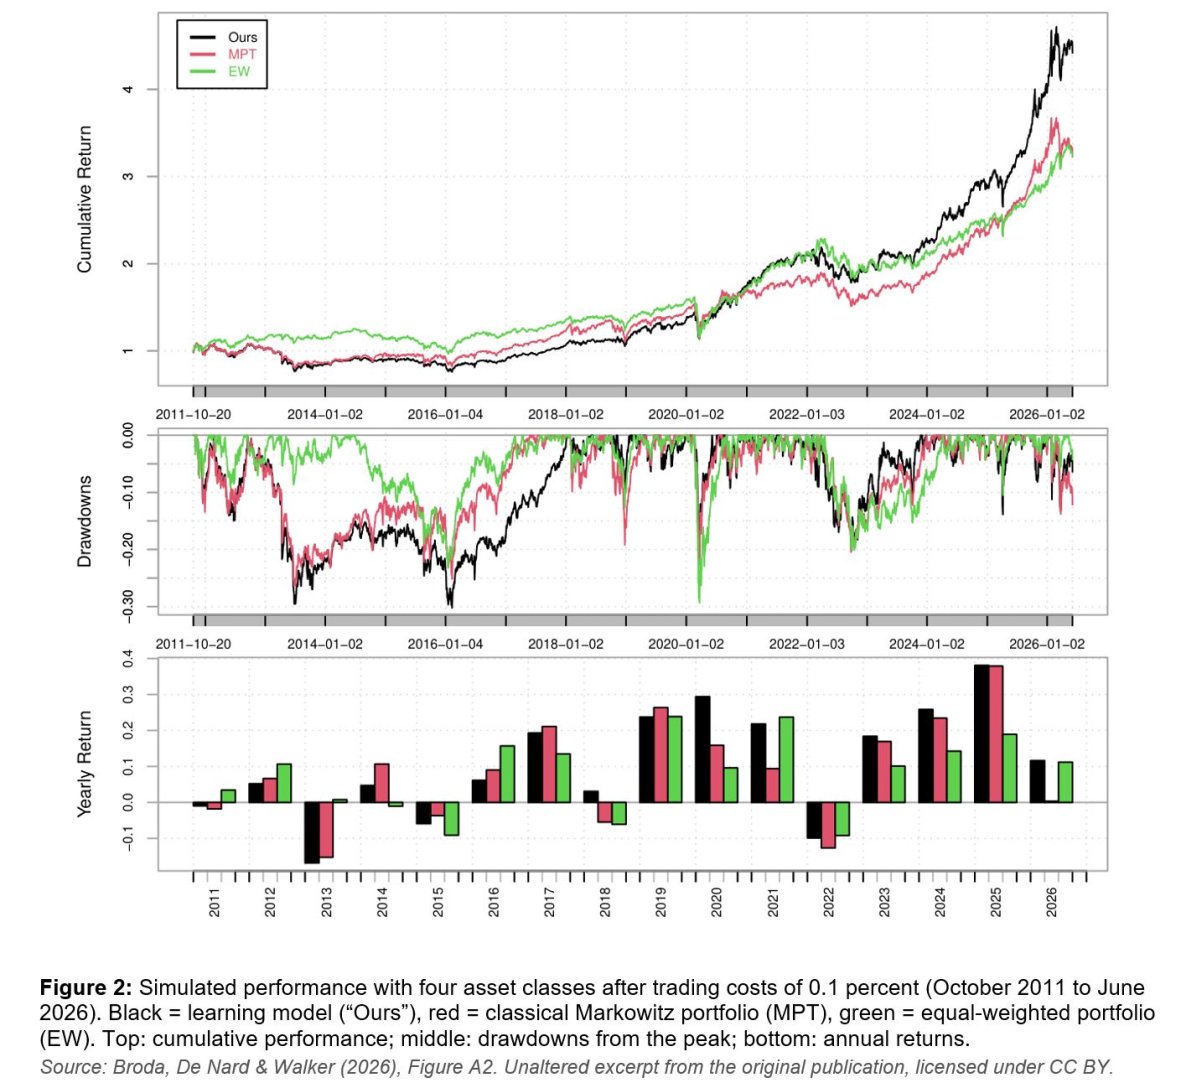
With four asset classes (stocks, gold, real estate, commodities), the learning model achieved a total return of around 374 percent before costs. In other words, 100 units would have grown to around 474. The Markowitz portfolio returned 235 percent, and the equal-weighted portfolio 222 percent. After deducting trading costs of 0.1 percent of the traded volume, the lead held: 342 percent versus 228 and 220 percent (Figure 2). With all six asset classes, that is, including bonds, the model achieved 336 percent after costs, compared with 199 percent for the Markowitz portfolio and 138 percent for the equal-weighted portfolio.

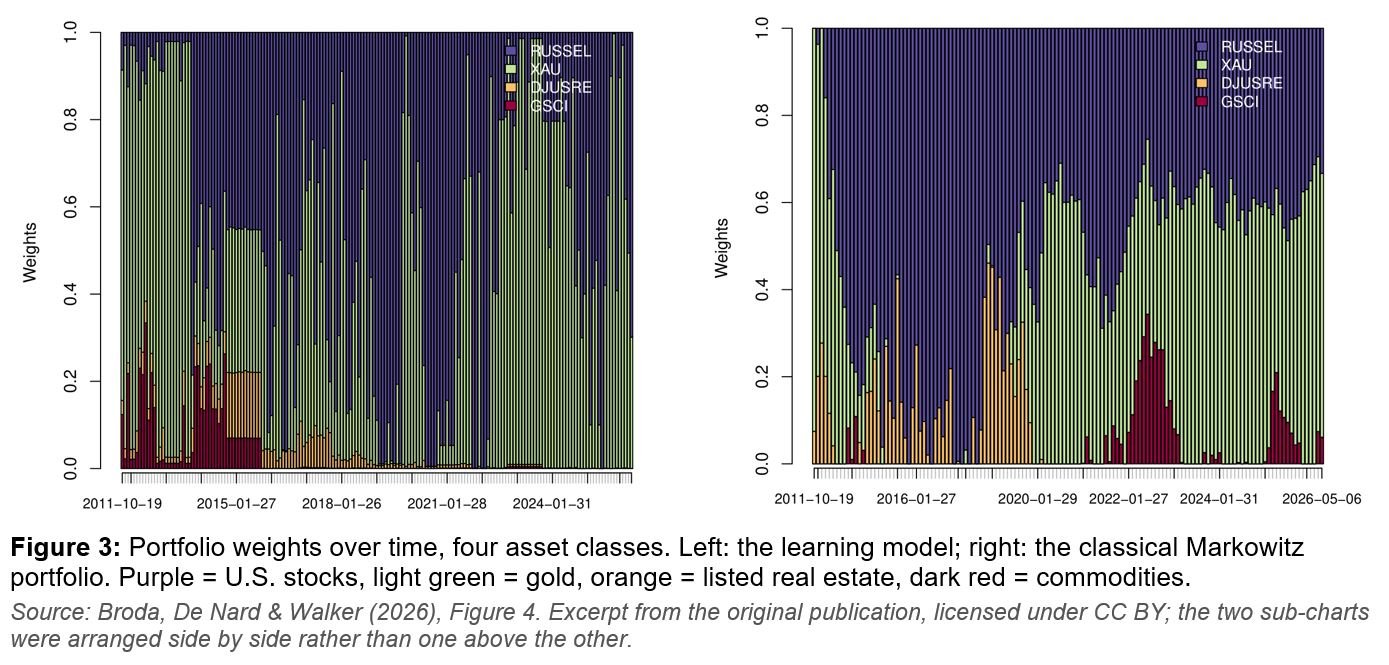
It is revealing how the model went about it (Figure 3). It rebalanced significantly more often and more aggressively than the Markowitz portfolio, above all between stocks and gold. According to the study, the lead with four asset classes indeed stems mainly from this timing. During the market crash in spring 2020, the model shifted almost entirely into gold and then quickly returned to stocks. During the 2022 rise in interest rates, it reduced stocks in favor of gold and held practically no interest-rate-sensitive real estate anymore. When bonds are also available, the model holds only little of them, whereas the classical Markowitz portfolio was invested mostly in corporate bonds until 2022.

Putting It in Context

The results are based on a historical simulation over a single period and predominantly U.S. markets. The return advantage over the Markowitz portfolio is economically large, but a large part of it arose after the COVID low in March 2020. The model also trades significantly more often. With six asset classes, it fluctuates more than the bond-heavy Markowitz portfolio, which achieves the better ratio of return to risk there. With caps per asset class, as is common in practice, the advantage tends to be smaller. Another problem in training the model was that, depending on the choice of the “random seed,” it recommends markedly different allocations, which is why the final model averages its allocation across a large number of different random seeds. This trick made it possible to achieve significantly more robust allocations over time.

Conclusion

The study shows that a comparatively simple reinforcement learning approach can keep pace with the tools that have been standard in asset management for decades, and in some cases clearly outperformed them on returns during the period examined. But it shows just as clearly where the limits lie. In investing, artificial intelligence is not a magic wand but a tool that must be carefully tested, understood, and controlled.

Source

[1] Broda, S. A., De Nard, G., & Walker, P. (2026). Dynamic Asset Allocation with Direct Policy Optimization: Evidence from a US Public-Market Multi-Asset Universe. Journal of Risk and Financial Management, 19(11), 855. https://doi.org/10.3390/jrfm19110855

The publication is freely accessible (open access) and is licensed under the Creative Commons Attribution license (CC BY). Figures 1 to 3 are excerpts from the original publication; in Figure 3, the two sub-charts were arranged side by side, but the charts are otherwise unaltered. The figure captions were written for this article. The research project was funded by Innosuisse (project no. 102.048 IP-SBM). Patrick Walker is employed by OLZ AG; Gianluca De Nard worked at OLZ AG for most of the project duration. This article is for informational purposes only and constitutes neither investment advice nor an offer. The results presented are based on historical simulations. Past performance is not a reliable indicator of future results.

We are always happy to talk to you.

A lasting relationship with our customers is worth more to us than mere success. Get in touch with us, we look forward to hearing from you. Or contact us directly: